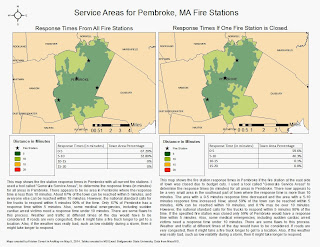
 For this project, I had to determine the response times for fire stations in Pembroke, MA. The map on the left shows the response times if all fire stations are open. The map on the right shows response times if the fire station on the east side of town, near Duxbury, was closed due to budget cuts. As shown in the maps, some people's response times would increase if that fire station was closed. I included tables to show the percentages of total town area and response times. To determine the response times, I used the "Generate Service Areas" tool, which takes roads into consideration. More details are described in the map text.
Monday, May 5, 2014
Service Areas for Fire Stations in Pembroke, MA
 For this project, I had to determine the response times for fire stations in Pembroke, MA. The map on the left shows the response times if all fire stations are open. The map on the right shows response times if the fire station on the east side of town, near Duxbury, was closed due to budget cuts. As shown in the maps, some people's response times would increase if that fire station was closed. I included tables to show the percentages of total town area and response times. To determine the response times, I used the "Generate Service Areas" tool, which takes roads into consideration. More details are described in the map text.
Service Areas for Massachusetts Community Colleges
Friday, May 2, 2014
GPS Map - Driving to School
View Larger Map This is a GPS map showing the route I took driving from my house to Bridgewater State University. I recorded my route using a smartphone app called My Tracks. The distance between each marker is 1 mile. The total distance was 16.8 miles.
St. Mary's Abbey Wind Turbine Project
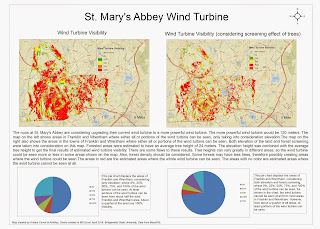
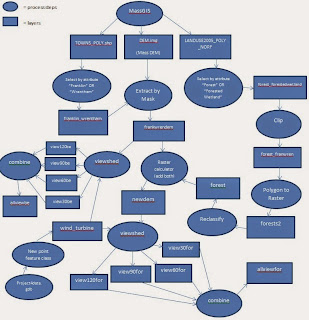
 For this project, I had to find all areas in Franklin, MA and Wrentham, MA where a wind turbine at St. Mary's Abbey in Franklin can be seen. The new wind turbine is 120 ft. tall. The map on the left shows all areas where all or portions of the wind turbine can be seen. This map shows results considering elevation only. The map on the right considers both elevation and the screening effect of trees. Some people may not be able to see the wind turbine if trees are blocking their view. I selected all areas that were labeled as forest or forested wetland and created a separate layer from that. I estimated the forest heights to be about 24 meters. I combined the forest layer with the DEM of Franklin and Wrentham to help create the results shown in the map. There are some flaws with this however. Some forests may have lower tree density or several different tree heights. So in some areas that are considered forested, the wind turbine might be seen in some areas. Below is a flowchart showing the steps I took to make both maps and also the layers and geoprocessing tools I used.

Subscribe to:
Comments (Atom)
