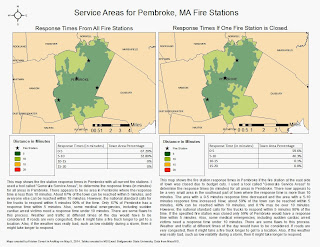
 For this project, I had to determine the response times for fire stations in Pembroke, MA. The map on the left shows the response times if all fire stations are open. The map on the right shows response times if the fire station on the east side of town, near Duxbury, was closed due to budget cuts. As shown in the maps, some people's response times would increase if that fire station was closed. I included tables to show the percentages of total town area and response times. To determine the response times, I used the "Generate Service Areas" tool, which takes roads into consideration. More details are described in the map text.
Monday, May 5, 2014
Service Areas for Fire Stations in Pembroke, MA
 For this project, I had to determine the response times for fire stations in Pembroke, MA. The map on the left shows the response times if all fire stations are open. The map on the right shows response times if the fire station on the east side of town, near Duxbury, was closed due to budget cuts. As shown in the maps, some people's response times would increase if that fire station was closed. I included tables to show the percentages of total town area and response times. To determine the response times, I used the "Generate Service Areas" tool, which takes roads into consideration. More details are described in the map text.
Service Areas for Massachusetts Community Colleges
Friday, May 2, 2014
GPS Map - Driving to School
View Larger Map This is a GPS map showing the route I took driving from my house to Bridgewater State University. I recorded my route using a smartphone app called My Tracks. The distance between each marker is 1 mile. The total distance was 16.8 miles.
St. Mary's Abbey Wind Turbine Project
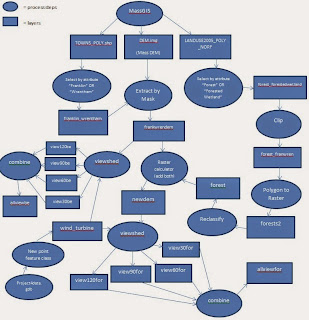
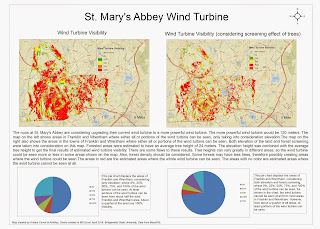 For this project, I had to find all areas in Franklin, MA and Wrentham, MA where a wind turbine at St. Mary's Abbey in Franklin can be seen. The new wind turbine is 120 ft. tall. The map on the left shows all areas where all or portions of the wind turbine can be seen. This map shows results considering elevation only. The map on the right considers both elevation and the screening effect of trees. Some people may not be able to see the wind turbine if trees are blocking their view. I selected all areas that were labeled as forest or forested wetland and created a separate layer from that. I estimated the forest heights to be about 24 meters. I combined the forest layer with the DEM of Franklin and Wrentham to help create the results shown in the map. There are some flaws with this however. Some forests may have lower tree density or several different tree heights. So in some areas that are considered forested, the wind turbine might be seen in some areas. Below is a flowchart showing the steps I took to make both maps and also the layers and geoprocessing tools I used.
Wednesday, April 16, 2014
Massachusetts Community Colleges and Town Population
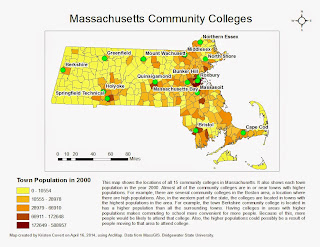 For this assignment, I had to locate all community colleges in Massachusetts using geocoding. Then I had to perform some kind of analysis. In my map, I show town population in the year 2000. Almost all of the community colleges are located in towns with higher populations in the area, and there are more colleges located in areas with the highest town populations. Some examples are explained in the map text.
Friday, March 28, 2014
Solar Wind Farm Project Maps
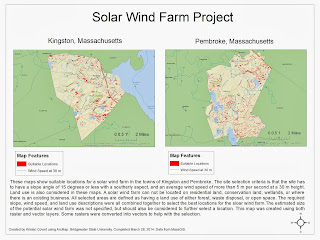
For this project, I had to find all suitable locations for a solar wind farm in Kingston, MA and a town of my choice (Pembroke, MA). The required selection criteria was that the site had to have a slope angle of 15 degrees or less, a southerly aspect slope (135 degrees to 225 degrees), and a wind speed of at least 5 m per second at a 30 m height. I also included land use in the criteria, where the land had to be described as either forest, waste disposal, or open space. I thought these three land use categories would be best for a solar wind farm location.Size of the the solar wind farm was not provided but should also be considered when choosing a location. I used several other raster and vector layers and geoproccessing/spatial analyst tools to come up with a final layer (shown in red on the map) that fits all 3 required criteria.
Solar Wind Farm Project (Pembroke)
This map is showing (in purple) possible locations for a solar wind farm in Pembroke, MA.
Here is the link to the web application for both the Pembroke map and the Kingston map: Web Application
Solar Wind Farm Project (Kingston)
This map is showing (in purple) possible locations for a solar wind farm in Kingston, MA.
Friday, March 7, 2014
City of Brockton: New Industrial Park Project
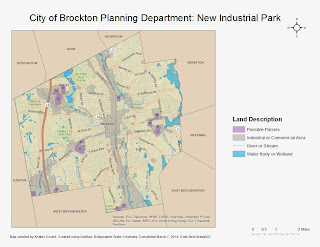
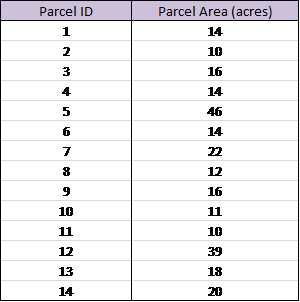
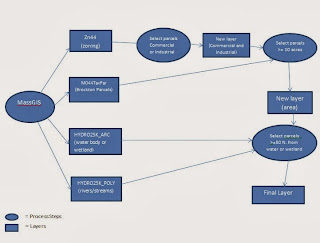 For this project, I had to locate possible parcels for a new industrial park in Brockton, MA. In this report I included a map, a table, and a flow chart to show my steps in making the map.
Map Description: This map is showing possible locations for a new industrial park in Brockton. The requirements were that the parcel must be at least 10 acres in area, at least 50 feet from wetland or water, and must already be zoned as industrial or commercial. In the map above the purple represents possible parcels where the new industrial park could be located. The gray represents parcels that are industrial or commercial. All purple parcels are zoned as industrial or commercial as well. A total of 14 parcels are selected as being a possible location for the industrial park. The parcels are labeled on the map and in a table. The table also includes the size of the parcel.
Methods: I created this map in ArcMap, using data from MassGIS. From MassGIS, I downloaded a Brockton parcel layer, a zoning layer, and two hydrology layers. From the zoning layer, I selected all parcels that were categorized as industrial or commercial for general use. I created a new layer based on these results. From that new layer, I selected all parcels that are greater than or equal to 10 acres in area. I then created a new layer from those results. And from that layer, I selected the parcels that are at least 50 feet away from any water body or wetland. I created a new layer from those results, which are shown in purple on the map. These are the selected parcels to be a possible location for the new industrial park.
Data Analysis: A total of 14 parcels are selected as possible locations for the new industrial park, based on the given criteria. However, the planning department may need to consider other site selection criteria. I was given the information that the parcel had to be at least 10 acres in area, but the projected industrial park size should be considered as well. How many buildings are there or will there be? How far apart will these buildings be from each other? If there is a plan for many buildings, then the larger of the selected parcels should be chosen. Location should also be considered. One of the criteria, was that the location had to be at least 50 feet from water or wetland. Other things should be considered, like if it is located along a major road, or close to a residential area. Also, the parcel should not already have an existing business on it. For example, the 3 parcels in the top left of the map are located where there is a mall. So, those parcels would not be suitable for a new industrial park. The parcel should probably be as far away from water or wetland as possible, in order to avoid any water contamination. The parcel along Belmont St. and Forest Ave would be a likely choice for the industrial park. It is not too close to any body of water, and appears to be in a location with no currently existing business. The parcels along the city boundary may not be the best choices if the planning department wants the park more within the city. The parcel near E. Ashland St. is close to a body of water, so that may not be the best choice. The 4 parcels on the right of the map may be good locations. Proximity to residential locations should be considered, because residents may not like the idea of living close to a large industrial or commercial park. If the only criteria would be to have the parcel be >= 10 acres, then there would be many more options. But you could possibly run into issues with conservation and other businesses. If doing this type of assignment with all Massachusetts towns, it would be best to work with all towns at once, instead of doing it one town at a time. That way it would require the same amount of steps. A way to make this map more convenient to use would be to put it into ArcGIS Online and share it or save it as a JPEG and upload it to a website or blog.
Friday, February 28, 2014
Town Revitalization Project
 This is a poster displaying maps and charts I created using ArcMAP and MS Excel. The town of Bellingham in Massachusetts is planning to revitalize a part of their town: Pulaski Blvd. For this project, we had to create several maps identifying and and distinguishing between the different types of parcels in the neighborhood. I worked with the data given to us from the town of Bellingham. Descriptions and details are shown on the poster.
Tuesday, February 18, 2014
Walt Disney World Theme Parks
View Larger Map For this assignment, I had to label locations with pop-up information and pictures. I put latitude and longitude information into a MS Excel sheet, along with other attribute information about the location. I saved it as a CSV file and imported it into ArcGIS Online. I chose to label the Walt Disney World theme parks with unique symbols. Each symbol is a different size and represents the area difference(in acres) of each park. Larger symbols represent parks with a larger area. I got the data and pictures from Google. Here is the link to the Web Application: Web Application
Schools I Have Attended
this is my map
View Larger Map
iew Larger Map For this map, we had to do geocoding/mapping addresses. This is a map showing the locations of all the schools I have attended. I chose Imagery Basemap and zoomed into the locations of each school. I used the editing tool to select each school and label it as a point. Each location includes the name of the school and the school's address. I created this map on ArcGIS Online. Here is the link to the Web Application of this map: Web Application
Angelina Jolie's Tattoo Coordinate Locations
View Larger Map Adding (x,y) data into ArcGIS Online: This is a map showing the latitude and longitude locations of Angelina Jolie's tattoo. For this assignment, I put the latitude and longitude coordinates into a MS Excel sheet, saved it as a CSV, and imported it into ArcGIS Online. Web Appication
Newest Bridgewater State University Buildings
View Larger Map This is a digitized map showing the three newest buildings on the Bridgewater State University campus. The buildings are labeled with the name of the building and the year the building was completed. On ArcGIS Online, I created a polygon (an area editing tool) over each building to highlight where each building is. Web Application
Subscribe to:
Comments (Atom)
